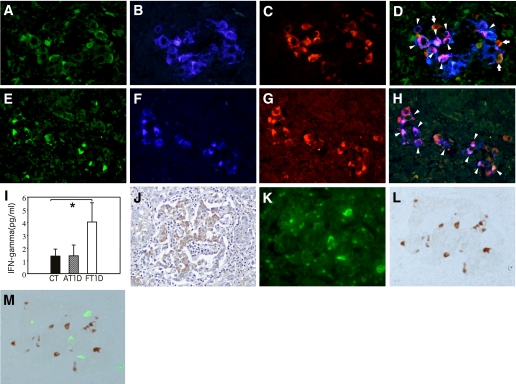
FIG. 3.
Immunohistochemical staining of IL-18, insulin, CXCL10, IFN-γ, and FasL. A–D: Triple-immunostaining of IL-18 (A), insulin (B), and CXCL10 (C). The merged image (D) shows that most β-cells express both IL-18 and CXCL10 (arrowheads). Some islet non–β-cells also express IL-18 and CXCL10 (orange, arrows) (×400, case 2). E–H: Triple-immunostaining of IL-18 (E), insulin (F), and IFN-γ (G). The merged image (H) shows that most β-cells express both IL-18 and IFN-γ (arrowheads) and that some islet non–β-cells also express IFN-γ (red) (×400, case 2). I: Serum levels of IFN-γ in patients with fulminant type 1 diabetes (FT1D) or with typical acute-onset type 1 diabetes (AT1D) and nondiabetic control (CT) subjects. Values are expressed as means ± SE; *P < 0.05. J: Immunostaining of Fas in islets affected by fulminant type 1 diabetes (brown) demonstrates strong expression of Fas in islet cells (×200, case 2). K–M: Double-immunofluorescent staining of insulin (K) and FasL (L). The merged image (M) shows that FasL-positive cells infiltrate the islets (×400, case 3). Color balance of M has been adjusted. (A high-quality digital representation of this figure is available in the online issue.)

