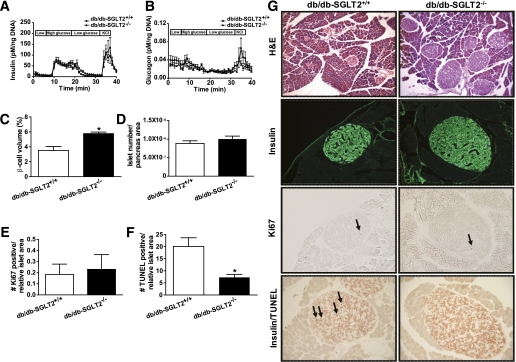
FIG. 4.
Pancreatic β-cell mass is increased in db/db-SGLT2−/− mice due to reduced frequency of cell death. A: Insulin secretion from isolated, perifused islets in response to low/high glucose and KCl. B: Glucagon suppression during the same experiment performed in A. C: Relative β-cell volume (islet area/pancreas area) determined from histologic analysis of pancreata. D: Islet number corrected by pancreas area. E: Frequency of β-cell proliferation determined as the number of Ki67/insulin-positive cells per relative islet area. F: Frequency of β-cell death was calculated as the number of TUNEL/insulin-positive cells per relative islet area. G: Representative images of histologic samples used for calculations in C–E. Pancreata stained as follows: panel 1, hematoxylin and eosin (H&E) stain; panel 2, insulin stain; panel 3, Ki-67 stain. Arrow denotes a Ki-67–positive cell; panel 4, TUNEL/insulin costain. Arrow denotes a TUNEL/insulin-positive cell. H&E viewed at original magnification ×40, all others at ×100. n = 3–7 per group. Data were analyzed by Student t test. *P < 0.05. Data represent the mean ± SEM. (A high-quality digital representation of this figure is available in the online issue.)

