FIG. 1.
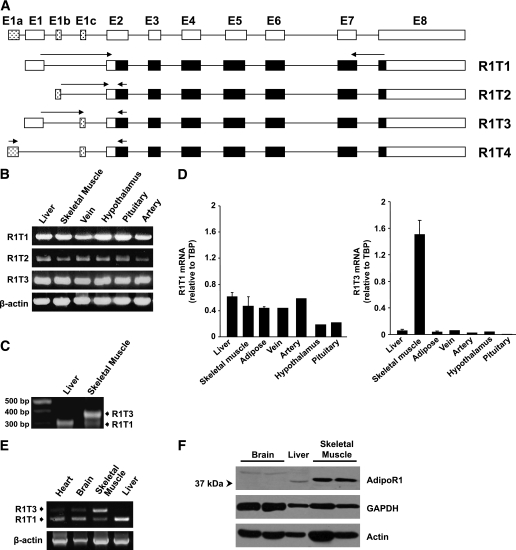
Identification and tissue distribution of human AdipoR1 5′UTR splice variants. A: Schematic representations of four predicted transcripts of AdipoR1. The noncoding and coding regions of AdipoR1 transcripts are represented by white and black boxes, respectively. The spotted boxes represent the putative novel exons. The arrows indicate the locations of primers used in the RT-PCR analysis. B: RT-PCR analysis using transcript-specific primers in various human tissues. C: Electrophoresis results of 5′-RACE PCR products from liver and skeletal muscle. 5′-RACE analysis was performed as described in the Supplementary Data. Molecular weight markers are shown in the far left lane. D: qPCR analysis of R1T1 and R1T3 mRNA expression in various human male tissues normalized to TBP. Each sample was measured in triplicates. Data are expressed as the means ± SD of the various tissues (n ≥ 2). E: Semiquantitative RT-PCR analysis of R1T1 and R1T3 expression in human tissues was performed using primers designed from exon 1 and exon 2 of AdipoR1 mRNA, which simultaneously detect both transcripts. F: Western blot analysis of AdipoR1 protein expression in human tissues. Equal amounts (50 μg) of protein lysates were resolved by means of 10% SDS-PAGE and were subjected to Western immunoblotting using anti-AdipoR1 antibody. Anti-GAPDH and anti-actin antibodies were used as loading controls.

