FIG. 3.
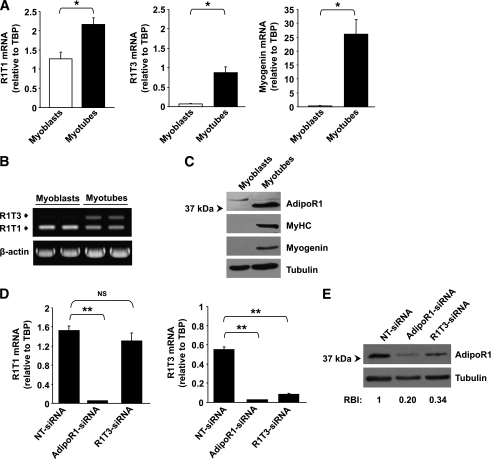
Alterations in AdipoR1 splice variants and AdipoR1 protein expression levels during h-SkMc differentiation and in knockdown experiments. A: qPCR analysis of R1T1, R1T3, and myogenin mRNA expression normalized to TBP in h-SkMc myoblasts and myotubes. Each sample was measured in triplicate. Data are expressed as the means ± SD of three independent experiments. B: Semiquantitative RT-PCR analysis of R1T1 and R1T3 expression (as described in Fig. 1) in h-SkMc myoblasts and myotubes. C: Western blot analysis of AdipoR1 protein expression in h-SkMc myoblasts and myotubes. Equal amounts (50 μg) of protein lysates were resolved by means of 10% SDS-PAGE and were subjected to Western immunoblotting using anti-AdipoR1, anti-MyHC, anti-myogenin (as differentiation markers), and anti-tubulin (as loading control) antibodies. D: qPCR analysis of R1T1 and R1T3 expression in h-SkMc transfected with siRNAs (n = 3). The cells were transfected with 100 nmol/L NT-siRNA, pool of siRNAs targeting different sites of the AdipoR1 ORF (AdipoR1-siRNA), or with siRNA targeting exon 1c (R1T3-siRNA). Forty-eight hours after transfection, cell differentiation was induced by incubation with differentiation medium for 10 days and mRNA expression was measured. Data are expressed as means ± SD. E: Western blot analysis of AdipoR1 protein expression in h-SkMc transfected with siRNAs as described above (n = 3). Equal amounts (40 μg) of protein lysates were resolved by means of 10% SDS-PAGE and were subjected to Western immunoblotting using anti-AdipoR1 and anti-tubulin (as loading control) antibodies. The relative band intensity (RBI) was determined by densitometry of AdipoR1 band intensity, normalized to tubulin band intensity. An average RBI value from three independent experiments is shown. P values were evaluated using Student t test. *P < 0.05; **P < 0.005. NS, nonsignificant.

