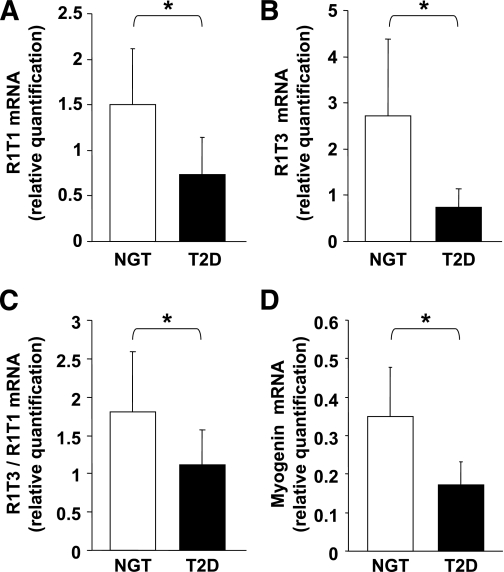
FIG. 4.
Evaluation of AdipoR1 transcripts and myogenin in human skeletal muscle of subjects with NGT and type 2 diabetes (T2D). R1T1 mRNA levels (A), R1T3 mRNA levels (B) and R1T3 mRNA relative to R1T1 mRNA expression (C) in subjects with NGT (n = 29) and type 2 diabetes (n = 20). D: Myogenin mRNA levels in subjects with NGT (n = 25) and type 2 diabetes (n = 12). Data are results of qPCR analysis expressed as means ± SD. Gene expression levels were normalized to β-actin mRNA levels. Relative quantification of gene expression was calculated as described under research design and methods. The P values were evaluated using Student t test. *P < 0.001.

