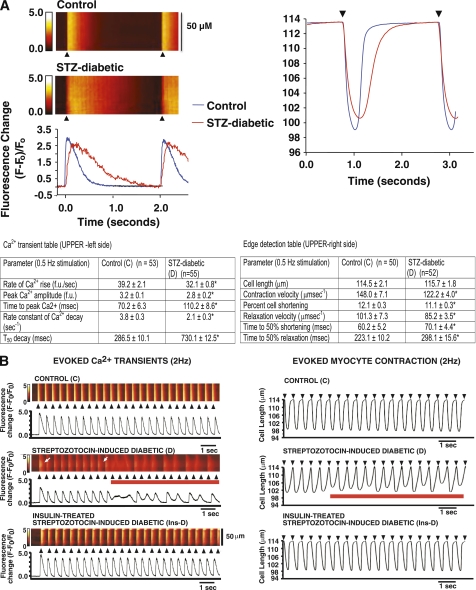
FIG. 3.
A, left side: Representative line-scan images of a single electrically evoked global Ca2+ transient and contraction kinetics (right side) of ventricular myocyte from control (C) and STZ-induced diabetic (D) rats. Values shown in the lower panel are means ± SE for n > 50 cells. *Significantly different from control rats (P < 0.05). B, left side: Consecutive evoked Ca2+ transients (≥20) in ventricular myocytes isolated from control (C), STZ-induced diabetic (D), and insulin-treated STZ-induced diabetic (Ins-D) rat hearts stimulated at 2 Hz. B, right side: Consecutive evoked contractions (≥20) of ventricular myocytes isolated from control (C), STZ-induced diabetic (D), and insulin-treated STZ-induced diabetic (Ins-D) rat hearts stimulated at 2 Hz. Black arrows indicate application of field stimulation (2 Hz), and red lines indicate abnormal Ca2+ transients and contractions. White arrows (left panel) represent variation in Ca2+ decay time along the scanned segment. (A high-quality digital representation of this figure is available in the online issue.)

