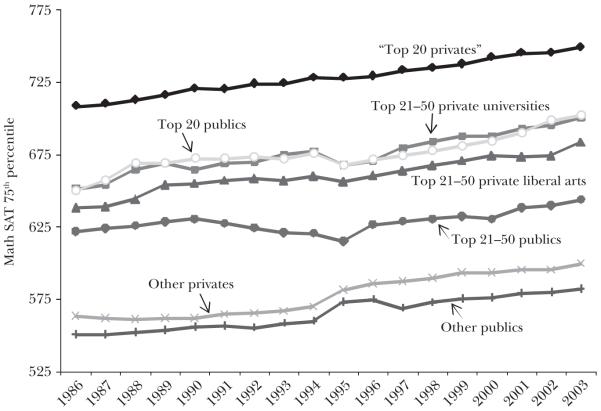
Figure 1. Math SAT 75th Percentile by Sector and Institution Ranking.
Source: American Survey of Colleges, College Board, 1986–87 to 2003–04.
Notes: The figure displays trends in the 75th percentile math SAT score of schools’ student bodies; the results are broken down by institutional sector and ranking. The “Top 20 privates” category includes the top 20 private universities and top 20 liberal arts colleges. To be included in the sample, institutions must have had at least 16 of the 18 possible years of data.

