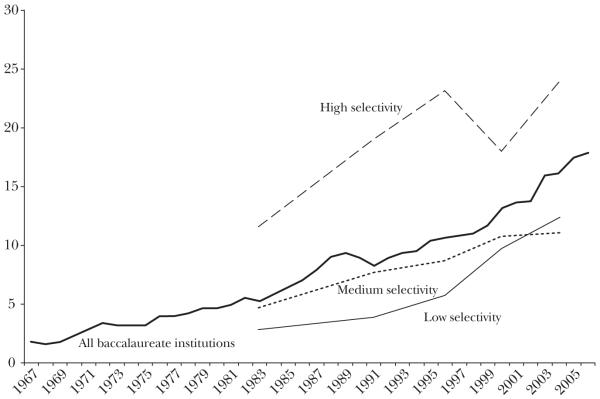
Figure 2. Percentage of Students Reporting Having Applied to 7+ Schools.
Source: The American Freshman, Cooperative Institutional Research Program (CIRP), various years.
Notes: CIRP attempts to make its sample nationally representative by stratifying participating schools by control, highest degree awarded, and selectivity, and then weighting responses to population totals from the Integrated Postsecondary Education Data System (IPEDS). The selectivity metric used is time-varying and based on mean composite SAT score (or ACT equivalent). As a rule of thumb, high selectivity is fairly similar to our combined select private and select publics.

