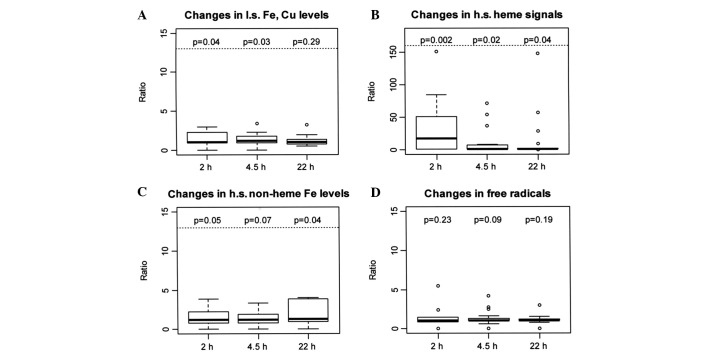
Figure 1.
Box plots of ratios at 2, 4.5 and 22 h to baseline values. The top and bottom edges of the boxes represent the 25th and 75th percentiles of the data. The black line inside the box represents the median. The 5th and 95th percentiles are represented by the whiskers extending from the top and bottom of the box.

