Figure 3.

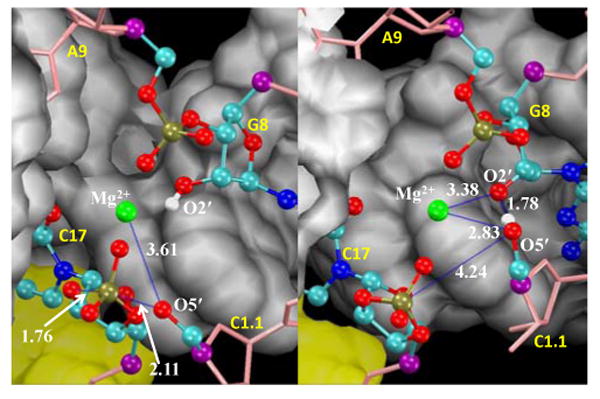
Snapshots of the active site at the transition states for phosphoryl transfer (left) and general acid catalysis (right) with average distances labeled.

Snapshots of the active site at the transition states for phosphoryl transfer (left) and general acid catalysis (right) with average distances labeled.