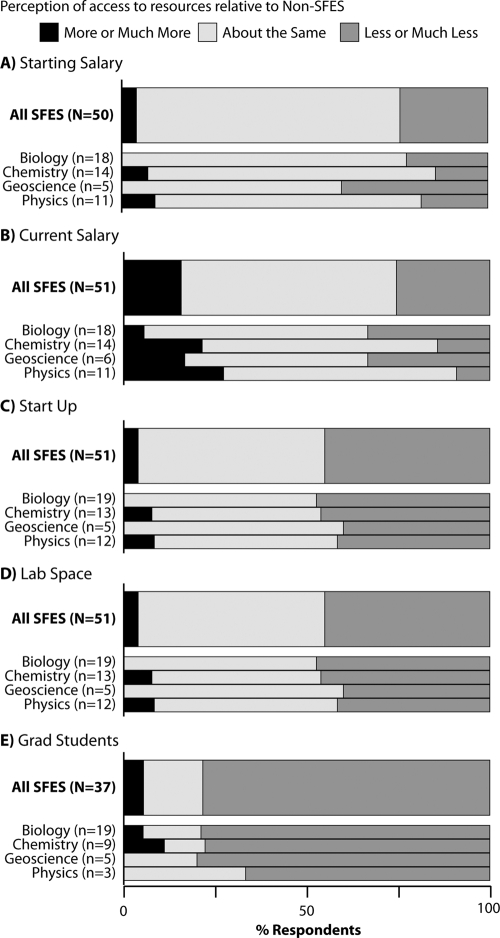
Figure 8:
SFES perceptions of access to resources compared with non-SFES. Reported relative starting salary (A), current salary (B), start-up package (C), lab space (D), and access to graduate students (for SFES in departments with graduate programs; E) for all SFES and disaggregated by science discipline.

