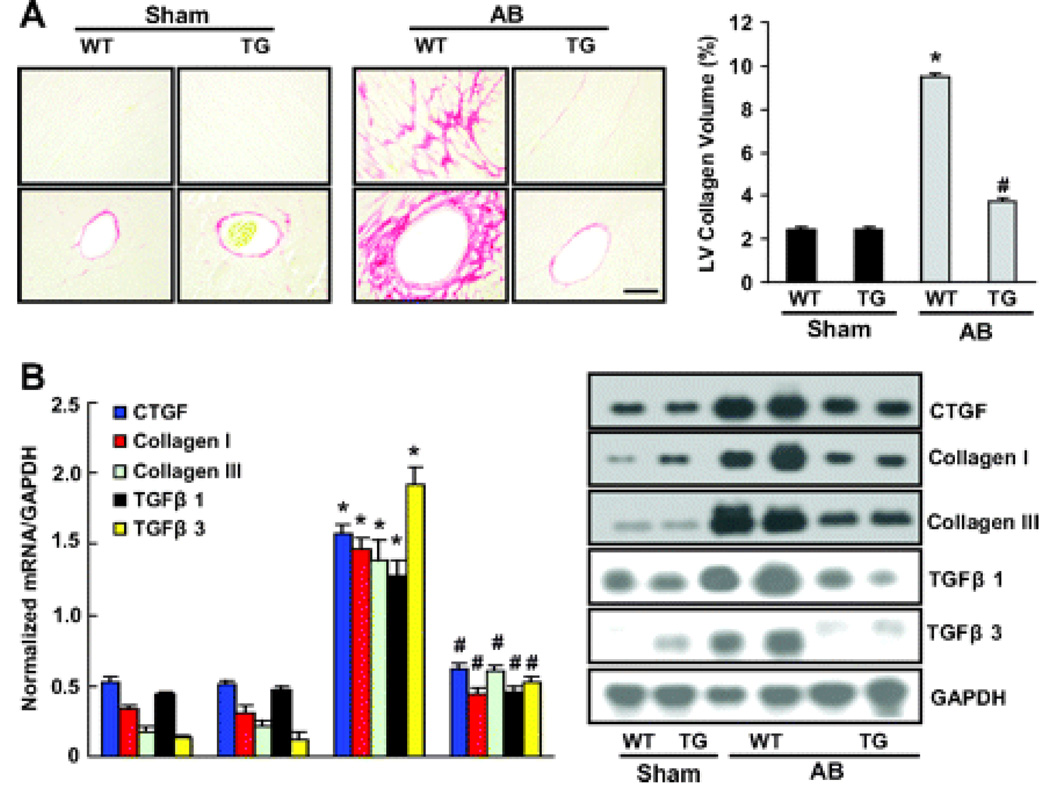
Figure 4.
The effects of A20 on fibrosis in vivo. A, Picrosirius red staining on histological sections of the left ventricle (LV) was performed on indicated groups after 8 weeks AB. The magnification of images were X400. Fibrotic areas from histological sections were quantified using an image-analyzing system (n=5). *P<0.01 vs WT/sham. #P<0.01 vs WT/AB after AB. B, Northern blot analyses of connective tissue growth factor (CTGF), collagen I, collagen III, TGF-β1, and TGF-β3 were performed to determine mRNA expression levels in indicated groups. GAPDH was used as the normalization control. Data represent typical results of 3 different experiments as mean±SEM (n=4 to 5 mice per group). *P<0.01 vs WT/sham. #P<0.01 vs WT/AB after AB.

