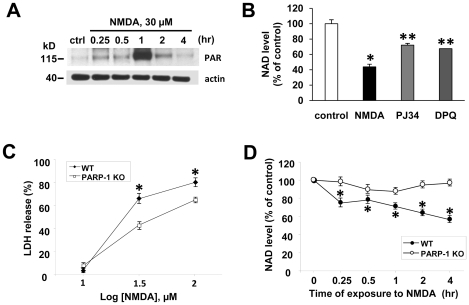
Figure 2. PARP-1 activation depletes cellular NAD in NMDA-treated neurons.
(A) Western blot of PAR in neurons exposed to NMDA (30 µM) for indicated times. The signal of PAR peaked 1 hr after NMDA treatment. β-actin was used as a loading control. (B) NAD level was measured in neurons 4 h after exposure to NMDA alone, NMDA plus PJ34 (100 nM), or NMDA plus DPQ (25 µM) (mean ± SEM; n = 4; *P<0.01, difference from untreated control; **P<0.01, difference from NMDA alone). (C) LDH was measured in neuron cultures of WT or PARP-1 KO mice 24 h after NMDA exposure. (mean ± SEM; n = 8; *P<0.01, difference from the relevant controls of PARP-1 KO culture). (D) NAD level was measured in WT or PARP-1 KO cultures exposed to NMDA 30 µM for indicated times (mean ± SEM; n = 8; *P<0.01, difference from the relevant controls of PARP-1 KO culture).

