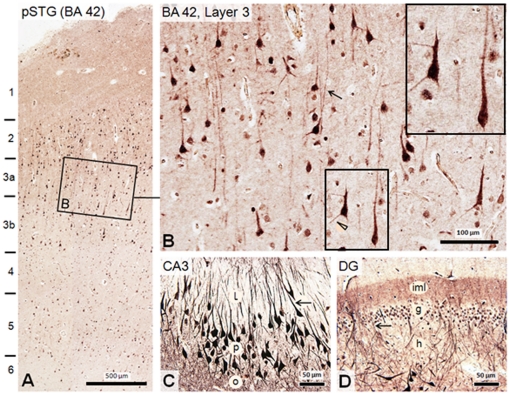
Figure 2. Distribution of dysbindin-1 in normal human pSTG and HF as seen immunohistochemically with PA3111.
A: While higher neuropil concentrations of the protein are evident in the HF, dysbindin-1 is also present in neuropil of the pSTG, most notably in superficial layers 1–3. B: Higher magnification view of boxed area A, which reveals dysbindin-1 not only in neurons of Brodmann area (BA) 42, but in pyramidal cell apical and basal dendrites such as those indicated by an arrow and arrow head, respectively. Inset shows higher magnification of boxed field. The smaller, less immunoreactive cells may be interneurons. Higher dysbindin-1 levels are seen in pyramidal cells of hippocampal field CA3 (C) and in polymorph cells of the dentate gyrus (DG) (D), including dendrites (arrowed) and axon terminal fields of those cells. l, o, and p = strata lucidum, oriens, and pyramidal of CA3, respectively; g, h, iml = granule cell, hilus, and inner molecular layer of the DG, respectively.

