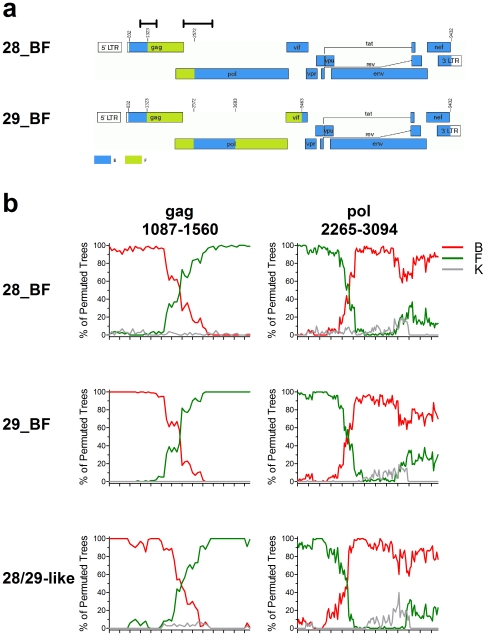
Figure 1. Mapping the recombination breakpoints of CRF.
(A) Recombination patterns of the CRF28_BF and CRF29_BF genomes. The number at each recombination breakpoint indicates the nucleotide position according to HXB2 numbering. Blue, subtype B; Green, subtype F1. Black bars above the HIV-1 genome indicate the gag (1,087–1,560) and pol (2,265–3,904) regions analyzed in this study and in the subsequent bootscanning analyses. (B) The bootscanning of CRF28_BF, CRF29_BF and CRF28/29_BF-like recombinant genomes revealed a similar recombination breakpoint. The recombinant sequences identified in RIP were subjected to bootscanning, and representative results are shown. The query sequence was compared with subtype B, F1 and K consensuses obtained from RIP, and plots of percentages of permuted trees against nucleotide positions are shown. Red, subtype B; green, subtype F1, grey, subtype K. A window/step size of 200/10 was used to analyze the sequences.

