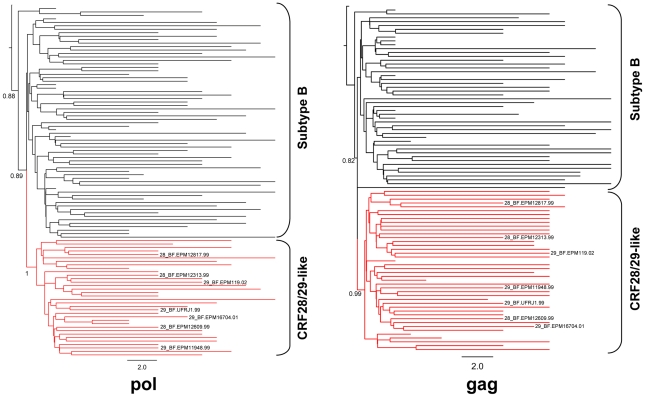
Figure 2. Bayesian evolutionary analysis by sampling phylogenetic trees of Brazilian subtype B and CRF28/29_BF-like HIV-1.
The maximum clade credibility phylogenetic trees of the pol and gag genes are shown. The brackets indicate the monophyletic group formed by each lineage. The subtype B lineage is in black, and the CRF28/29_BF-like lineage is in red. Positions of the CRF28_BF and CRF29_BF references are indicated. Posterior probability values greater than 0.8 are shown at nodes.

