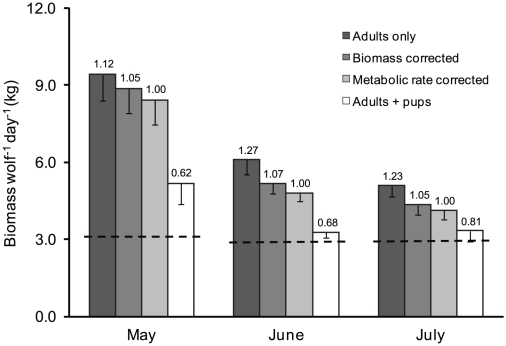
Figure 4. Estimates of per capita rates of prey acquisition based on different methods for determining pack size.
The number above each bar represents the rate in proportion to the metabolic corrected rate. Vertical bars represent the standard error. The dashed lines represent the estimated minimum daily energetic requirement (3.84 and 3.59 kg wolf−1 day−1 in May and June/July, respectively) for adult wolves in our study area [37].

