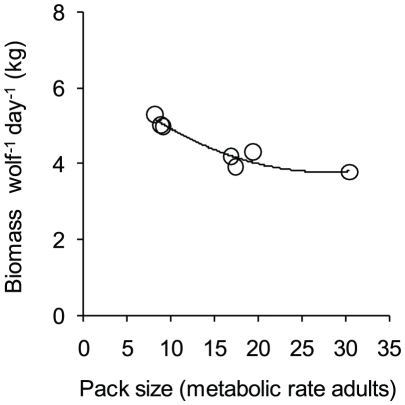
Figure 5. Rates of prey acquisition (kg wolf−1 day−1) during June and July in relation to pack size.
Pack size is determined as the number of metabolic-rate-adult-equivalent wolves (see Pups and prey acquisition rates). The line represents the best fitting polynomial regression: y = 6.58 – 0.20x+0.004x 2 (R2 = 0.92, P<0.01).

