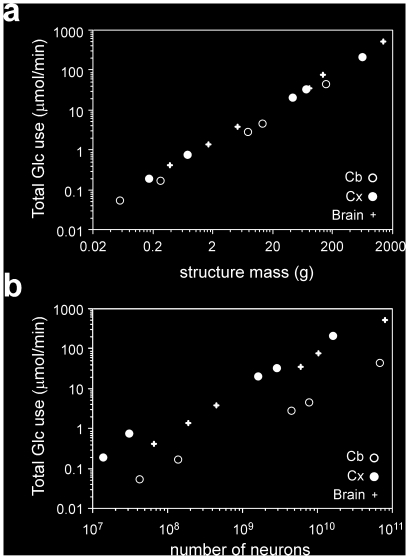
Figure 1. Scaling of total glucose use by the whole brain, cerebral cortex and cerebellum.
a, total glucose use by the whole brain (+), cerebral cortex (black circles) and cerebellum (white circles) scales with structure mass raised to similar exponents of 0.873, 0.850 and 0.844. b, total glucose use by the whole brain (+), cerebral cortex (black circles) and cerebellum (white circles) scales with the number of neurons in each structure in a manner that is best described as a linear function. Whole brain: power exponent 0.988, p<0.0001; linear fit, r2 = 1.0, p<0.0001. Cerebral cortex: power exponent 0.944, p = 0.0002; linear fit, r2 = 1.0, p<0.0001. Cerebellum: power exponent 0.880, p = 0.0001; linear fit, r2 = 1.0, p<0.0001.

