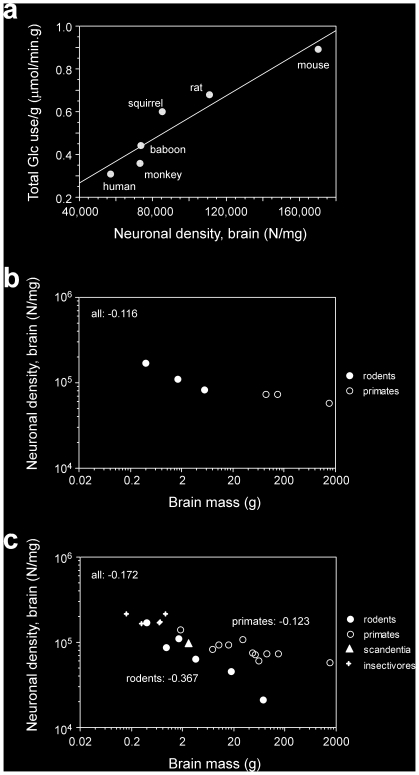
Figure 2. Scaling of average specific glucose use in the brain and neuronal density.
a, Average glucose use per gram of brain tissue scales linearly with neuronal density. Each point represents the average values for the present species indicated (see Table 1). Average glucose use per gram of brain tissue is best described as a linear function of neuronal density across the species (r2 = 0.906, p = 0.0034), or as a power function of neuronal density with an exponent close to unity (0.986, p = 0.0041). b, Neuronal density in the whole brain varies across the six species in the present sample as a power function of brain mass with an exponent of −0.116 (p = 0.0071). c, Neuronal density in the whole brain is not a universal function of brain mass: while it does not vary significantly with brain mass across insectivores (crosses), it decreases slightly with brain mass raised to an exponent of −0.123 across primates (p = 0.0016, unfilled symbols); more steeply with brain mass raised to an exponent of −0.367 across rodents (p = 0.0011, filled symbols); and with an intermediate exponent of −0.172 across the ensemble of species (p<0.0001). For subsets of mammalian species, the scaling exponent depends on the particular species.

