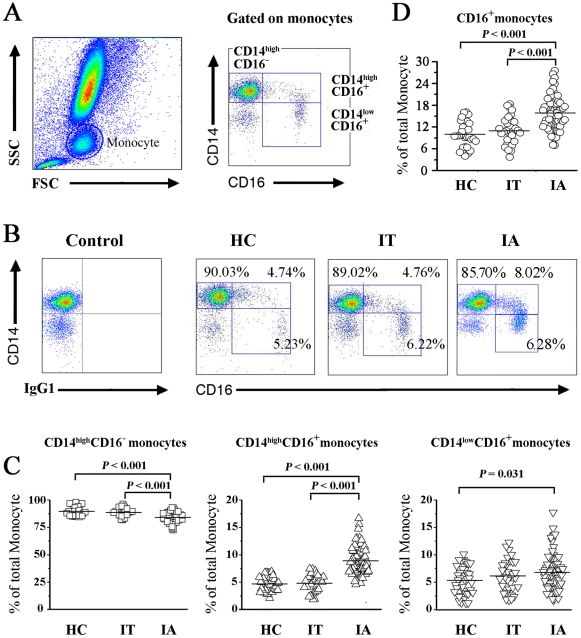
Figure 2. Peripheral CD16+ monocyte frequencies are significantly increased in IA patients.
(A) Monocyte subsets in whole blood were identified based on forward and side scatter (left panel) and CD14/CD16 expression patterns (right panel). Monocytes were further divided into the CD14highCD16− subset and a major CD16+subsets; the latter were further divided into CD14highCD16+ and CD14lowCD16+ subsets for analysis. (B) Representative dot plots of three monocyte subsets in IT, IA patients and healthy controls. Values in the quadrants indicate the proportions of monocyte subsets. (C) Individual values of the three monocyte subsets in IT, IA patients and healthy controls. P values are shown. Horizontal bars represent the median proportions of each monocyte subset. (D) Individual values of major CD16+ monocyte subsets in IT, IA patients and healthy controls. P values are shown. Horizontal bars represent the median proportions of the CD16+ monocyte subsets. IT, Immune tolerant carriers; IA, immune activated patients.

