Fig. 7.

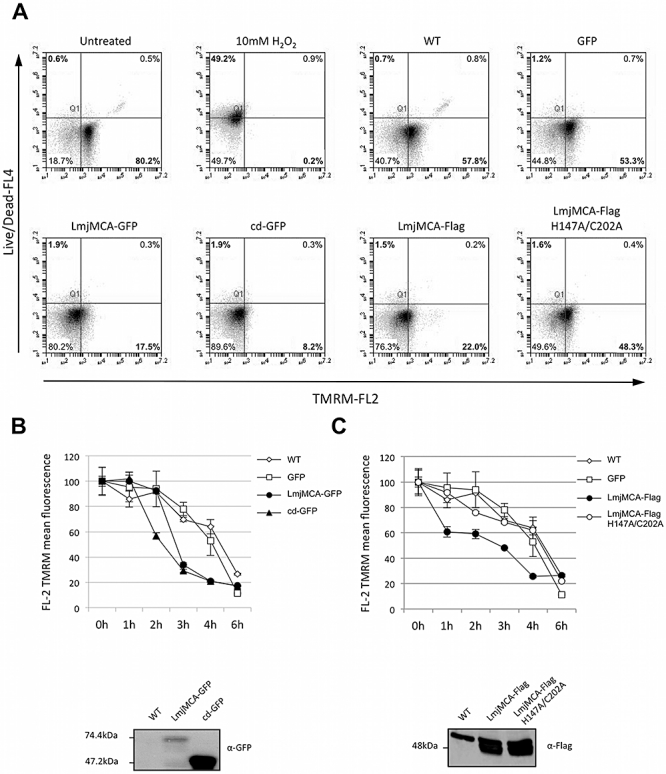
Mitochondrial membrane potential. Parasites were exposed to 0.5 mM H2O2, harvested every hour, incubated with the TMRM dye and analysed by flow cytometry to detect the loss of mitochondrial membrane potential.
A. Mitochondrial membrane potential and cell integrity analysis after 3 h H2O2 treatment of parasites expressing wild type (WT), GFP, LmjMCA–GFP, cd–GFP, LmjMCA-Flag and LmjMCA-Flag H147A/C202A. Negative (untreated) and positive (10 mM H2O2, 1 h) controls are shown in the two first dot plots respectively. Percentages of healthy (TMRM-positive, Live/Dead-negative) and necrotic (TMRM-negative, Live/Dead-positive) cells are shown in bold.
B. Mitochondrial membrane potential analysis over 6 h H2O2 treatment of parasites expressing WT, GFP, GFP-tagged full-length metacaspase (LmjMCA–GFP) and metacaspase catalytic domain (cd–GFP).
C. Mitochondrial membrane potential analysis over 6 h H2O2 treatment of parasites expressing WT, GFP, Flag-tagged full-length metacaspase (LmjMCA-Flag) and its catalytically inactive version (LmjMCA-Flag H147A/C202A).
Lower panels show immunoblots of protein extracts from each analysed sample with the level of expression of LmjMCA–GFP, cd–GFP and LmjMCA-Flag, LmjMCA-Flag H147A/C202A using anti-GFP and anti-Flag antibodies respectively.
