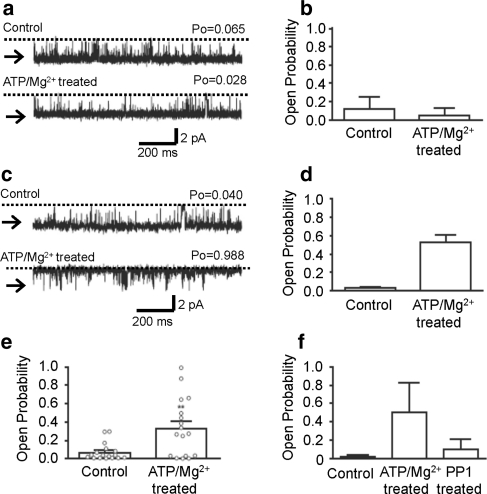
Fig. 2.
Effects of Mg2+/ATP treatment on RyR2 channel gating. a Representative current fluctuations through a single RyR2 channel that demonstrated no increase in P o after Mg2+/ATP treatment. b Mean P o from experiments where P o was equivalent or reduced after Mg2+/ATP treatment. Mean ± SEM (n = 7). c Representative current fluctuations through a single RyR2 channel where P o increased after Mg2+/ATP treatment. d Mean channel P o from experiments where P o increased after Mg2+/ATP treatment. Mean ± SEM (n = 10). e Histogram showing the mean channel P o of all experiments (regardless of whether P o increased or decreased) in the presence of 50 μM cytosolic Ca2+, before and after Mg2+/ATP treatment. Open circles show channel P o for the individual experiments. Mean ± SEM (n = 17, **P < 0.01). f Histogram illustrating the effect of PP1 treatment on RyR2 channels that displayed increased P o after Mg2+/ATP treatment. Control P o was determined in the presence of 50 μM cytosolic Ca2+ alone. The cytosolic face of the channel was then treated for 5 min in the presence of 1 mM ATP and 5 mM Mg2+ and washed back to control conditions. The cytosolic face of each channel was then incubated in the presence of a maximum of 12.5 units of PP1, for 10 min, before being washed out to control conditions. Mean ± SD (n = 3)

