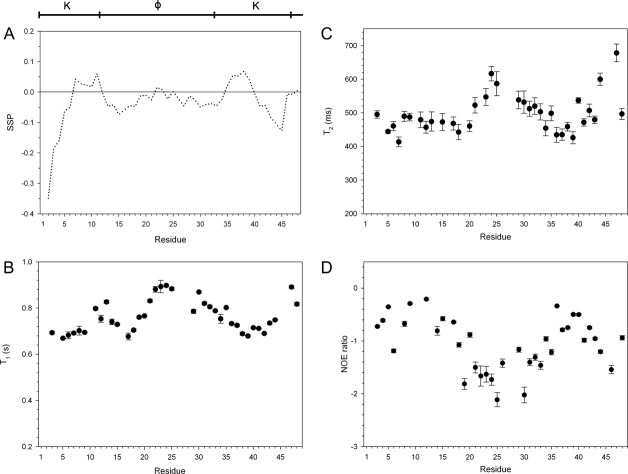
Figure 2.
Structure and dynamics of K2 in solution. The arrangement of the K- and φ-segments is shown at the top of the figure. A: The SSP scores of K2 were calculated using Hα, Cα, and Cβ chemical shifts and are plotted on a per residue basis. B: T1, (C) T2, and (D) 15N-NOE relaxation data of K2. Error bars represent the error in fitting the relaxation decay curves as described in CCPNMR.

