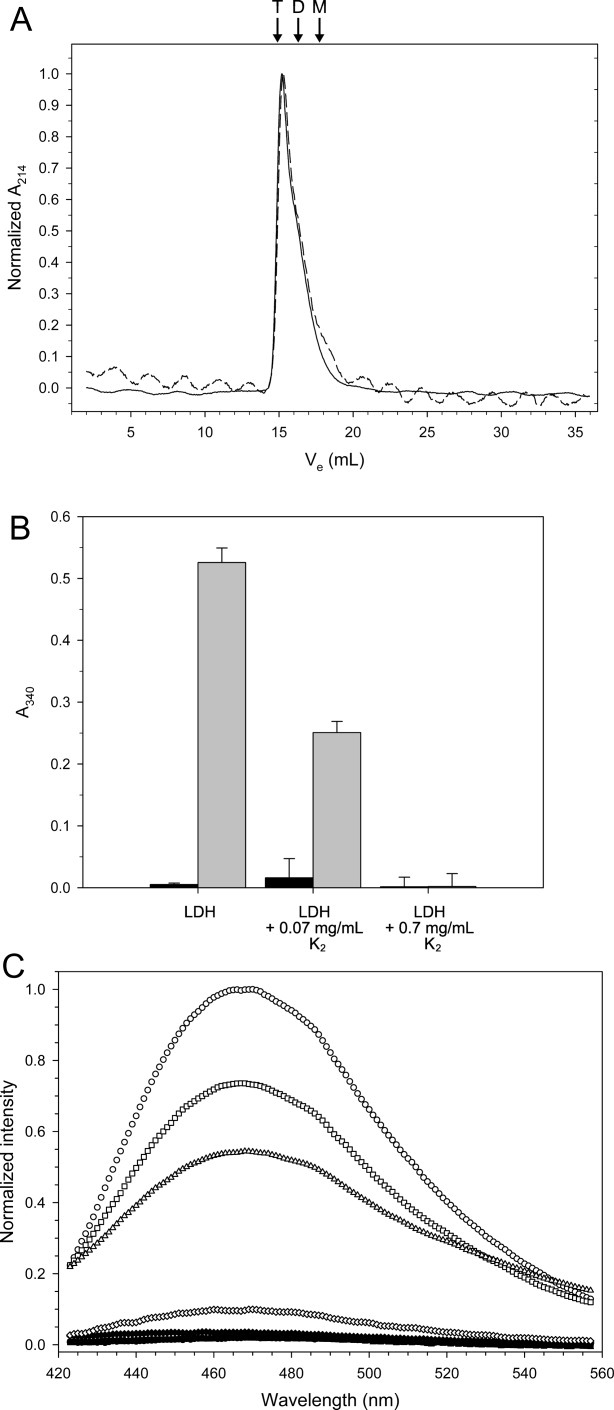
Figure 4.

Effect of freezing and freeze-protection on the structure of LDH. A: Gel filtration of 200 μg of LDH before (solid line) and after (dashed line) being frozen and thawed. The arrows and labels indicate the predicted elution volume of the various oligomeric states: T, tetramer; D, dimer; M, monomer. Ve represents the elution volume of the sample. B: Light scatter measured at 340 nm. The bar graph represents data from n = 6 measurements, and the error bars show their standard deviation. The sample conditions are listed below each entry, where black represents unfrozen samples and gray represents frozen and thawed samples. C: Emission scans of ANS fluorescence of 1 μM LDH in the presence and the absence of K2. Samples were scanned before (solid symbols) and after (open symbols) freeze-thaw treatment. Symbols: LDH alone, circle; LDH with 0.028 mg/mL K2, square; 0.28 mg/mL K2, triangle; 0.65 mg/mL K2, diamond.
