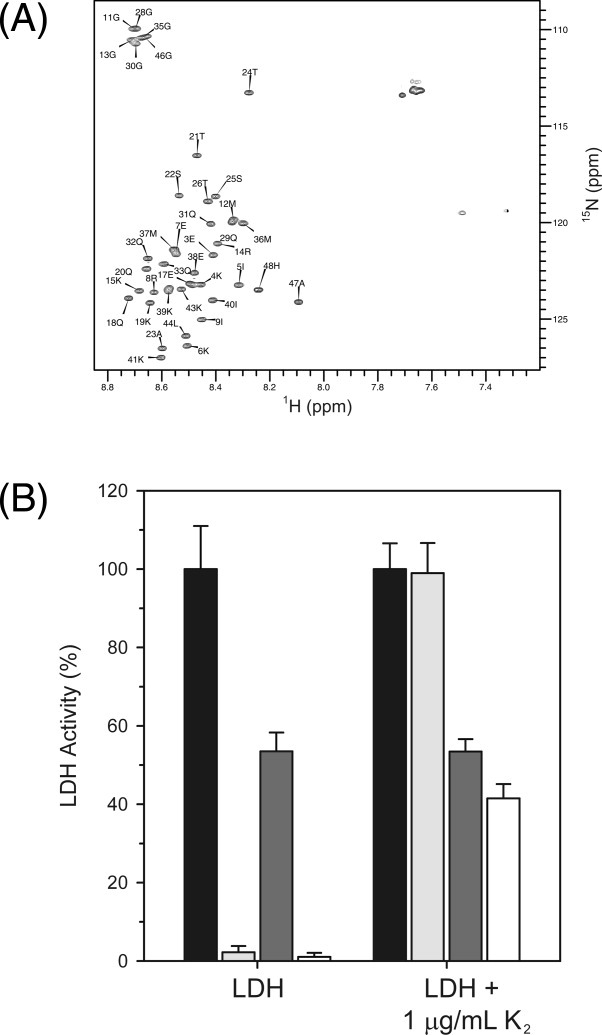
Figure 5.

K2 interaction with LDH. (A) 15N-HSQC of 0.1 mM of K2 collected in the absence (black contours) or the presence (gray contours) of 0.3 mM LDH. The peak labels show the residue number and single letter amino acid code of K2. B: Cryoprotection of LDH by K2 is mediated by weak electrostatic interactions. The bar graph shows the percent LDH activity of samples assayed in the presence and the absence of salt with and without 1 μg/mL K2. The data represent n = 6 measurements with the error bar corresponding to the standard deviation. Unfrozen samples with no NaCl, black bars; frozen samples with no NaCl, light gray; unfrozen samples with 1M NaCl, dark gray; frozen samples with 1M NaCl, white.
