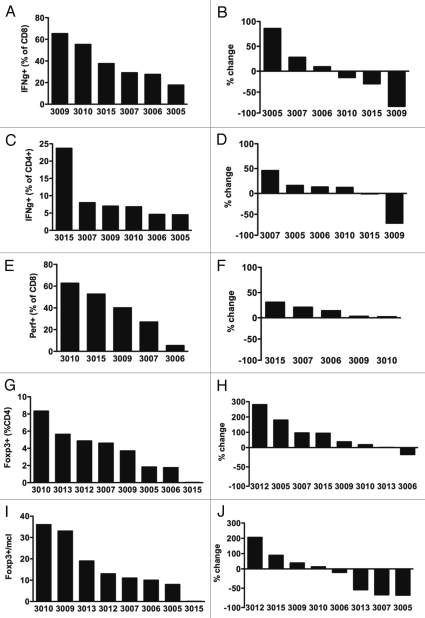
Figure 4.
Baseline parameters and treatment-related changes of IFNγ and perforin expression and regulatory T cells. Fraction of IFNγ among CD8+ (A) and CD4+ (C), fraction of perforin among CD8+ (E), fraction of FoxP3+ among CD4+ (G) and absolute Foxp3+ CD4+ cells per ul blood (I) at baseline. Relative changes comparing end of study to baseline in IFNγ among CD8+ (B) and CD4+ (D), fraction of perforin among CD8+ (F), fraction of FoxP3+ among CD4+ (H) and absolute count of Foxp3+ CD4+ cells (J).

