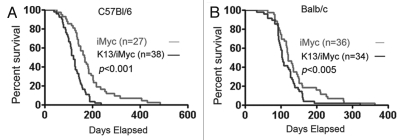
Figure 1.
Kaplan-Meier graph showing survival of iMycEµ and K13/iMycEµ mice on B6 (A) and Balb/c (B) backgrounds. Mice were monitored for 1 year. Mice that were found dead due to tumors and the mice that were euthanized due to tumor development were included in the survival curve. Log-rank test was used to determine the difference between the two genotypes.

