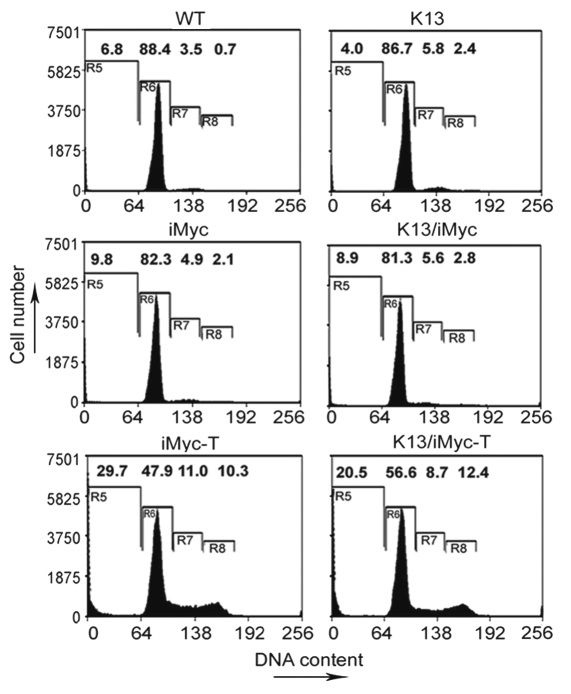
Figure 5.
DNA content analyses showing the percentage of apoptotic and proliferating cells in the tumor-bearing (T) and tumor-free single and double transgenic mice. Cell pellets were fixed in 70% ethanol, resuspended in 0.5 ml of 0.05 mg/ml propidium iodide plus 0.2 mg/ml RNase A and incubated at 37°C for 30 min. Cell cycle distribution was analyzed using a flow cytometer. The numbers represent the percentage of cells in the different phases of cell cycle. R5, Sub-G0/G1; R6, G0/G1; R7, S and R8, G2/M phases.

