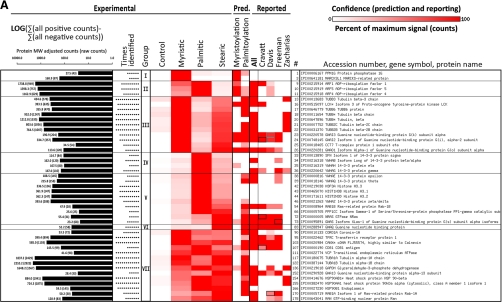
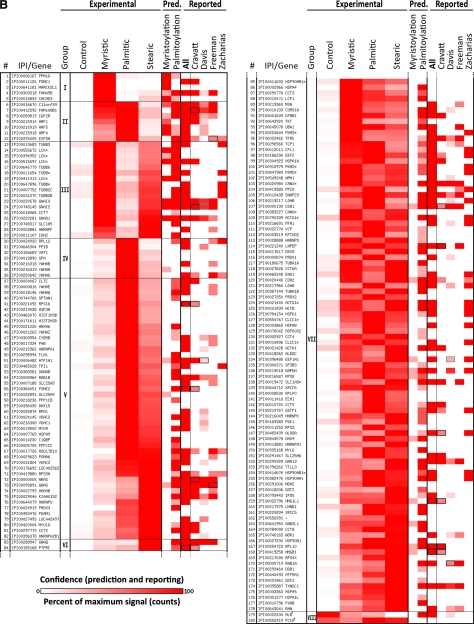
Fig. 2.
Proteins identified from Jurkat T cells metabolically labeled with click-chemistry compatible fatty acids of different chain lengths (myristic acid = az- and alk-12), (palmitic = alk-14), (stearic = az-15 and alk-16) or DMSO carrier control (-); high confidence only (≥ 5 identifications with fivefold enrichment over DMSO control). A, Selected examples; B, full list (next page). Proteins with the same gene symbol but different IPI numbers are marked with an asterisks (*). Under experimental, intensity of heat map coloration represents normalized peptide counts for each protein hit averaged over 6 independent proteomic experiments. Proteins are clustered by their propensity to be modified from short to long chain fatty acids and assigned to seven groups: I: modified mainly by myristic acid; II: modified mainly by myristic and palmitic acids; III: myristic and stearic acids; IV: palmitic acid; V: palmitic and stearic acids; VI: palmitic acid; VII: myristic, palmitic and stearic acids. Group VIII (next page) are proteins enriched in the negative control (marked with a dagger (†); counts are negatives in excess of positive). Proteins are sorted by the correlation between their averaged normalized signal strengths and the physical length of the fatty acid chains. Intensity of red in prediction and in comparative analysis to other reported experimental datasets represents confidence of prediction or identification, respectively, given criteria set by each work. N-terminal myristoylation was predicted by Myrbase. S-palmitoylated was predicted by CSS-Palm. In comparative analysis, a black box means a protein was identifiable by our data that matched an accession number published in other data sets, but which differs from the reported accession number of this figure because of additional sequence coverage or uncertainty in peptide-level identification. A gray box represents the same situation, except that (1) both an unlisted, interpretable accession number and the exact accession number listed match published reports; and (2) the confidence of the unlisted number is higher than the accession number listed here. In that case, the higher confidence of the unlisted accession number is shown. In A, at left, the total number of peptide counts in excess of any negative (log scale) and the number of times the protein was identified. Nearly four orders of magnitude are spanned (11–8075 raw counts). See also supplemental Fig. S4.


