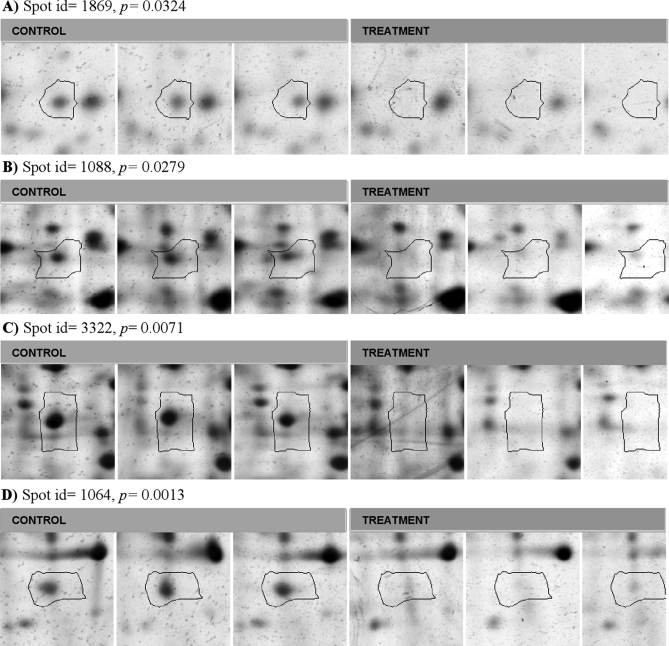
Fig. 1.
Example of some protein spots (Diz A. P. et al. unpublished data) from a 2-DE analysis from a gastropod mollusc. There were three biological replicates for each of two treatments. Significant p values at α = 0.05 or lower for comparison of treatments with a t test are shown. These spots were not declared significant after applying SB (0.05), BH 5%, and SGoF (0.05). Image analysis and montage preparation were carried out with Progenesis SameSpots versus 4.0 software.

