Fig. 3.
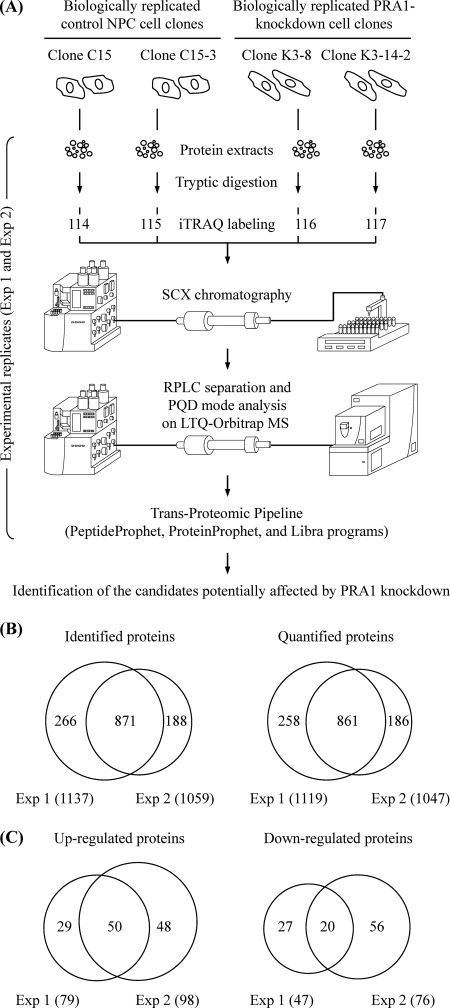
Identification of differentially expressed proteins in PRA1-knockdown NPC cell clones. A, Schematic diagram showing the workflow designed for profiling of the PRA1-affected proteins by iTRAQ-based analysis. The cell extracts were individually harvested from two control NPC cell clones and two PRA1-knockdown cell clones. These protein extracts were trypsin-digested, and the resulting peptides from each of four samples were labeled with corresponding iTRAQ reporters in parallel. The iTRAQ-labeled peptides were then pooled and applied to strong cation exchange (SCX) chromatography for fractionation, followed by reverse-phase liquid chromatography (RPLC) for further separation. The peptide identities and intensities were analyzed by LTQ-Orbitrap MS with PQD mode. Data analyses were then performed with the PeptideProphet, ProteinProphet, and Libra programs in the Trans-Proteomic Pipeline using the MASCOT algorithm as the search engine. As indicated, the iTRAQ experiment was conducted in duplicate (shown as Exp 1 and Exp 2). B, Number of proteins identified or quantified in two iTRAQ-based experiments. Venn diagrams show overlap between proteins identified or quantified in the two experiments. The total number of proteins identified or quantified in each experiment is listed in brackets. C, Number of proteins identified to be up-regulated or down-regulated in two iTRAQ-based experiments. Venn diagrams show overlap between proteins up-regulated or down-regulated in the two experiments. The total number of proteins up-regulated or down-regulated in each experiment is listed in brackets.

