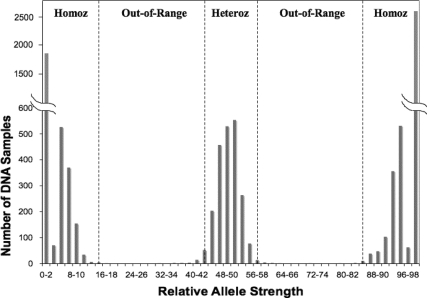
Fig. 2.
Distribution of RAS values for 18 X-chromosome markers in 496 Coriell Institute for Medical Research human diversity DNA samples. The range of RAS values (0–100%) for each marker was divided into 50 bins, each 2% wide (0–2, 2–4, 4–6…98–100%), and the number of DNA samples per bin were tabulated and plotted vs. the RAS values for each bin. The cutoff ranges for 16 of the 18 X-markers (all except XM4 and XM18) are shown by dashed lines. Heteroz, Heterozygous range; Homoz, homozygous range.

