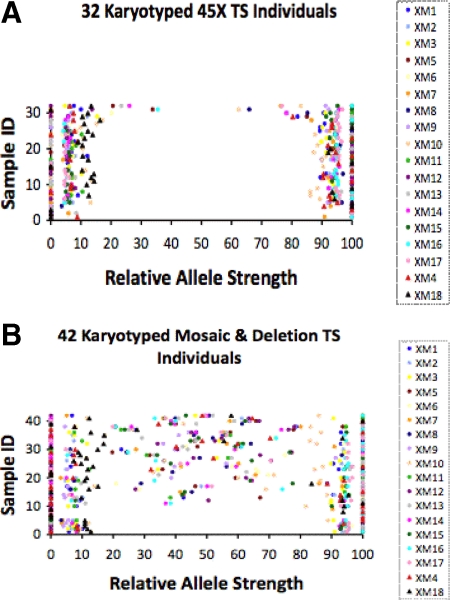
Fig. 4.
RAS values for 32 TS females with a 45X karyotype (A) and for 42 TS females with mosaicism or X-chromosome deletion karyotypes (B). The RAS data for each individual is plotted on a line parallel to the x-axis where the y-value is equal to the sample ID. A different colored symbol represents each of the 18 markers tested (inset). Sample ID was arbitrarily assigned from 1–32 (A) or 1–42 (B).

