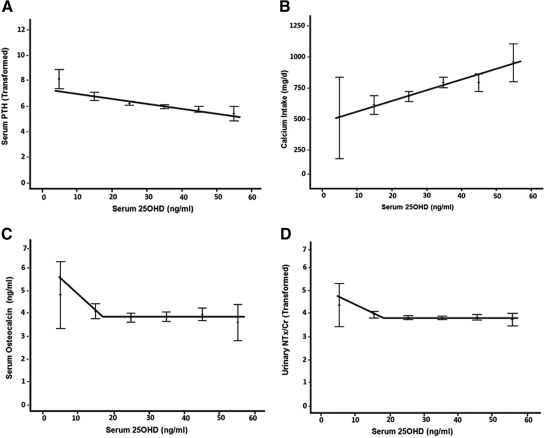
Fig. 2.
Relationship between serum 25OHD, serum PTH, bone markers, and calcium intake. A, Serum PTH was inversely correlated with serum 25OHD (r = −0.338, P < 0.0005) was continually decreasing with increasing serum 25OHD. Nonlinear regression failed to identify a threshold for serum PTH. Calcium intake was significantly positively correlated with serum 25OHD (r = 0.295, P < 0.0005; B). For serum osteocalcin, nonlinear regression converged on a threshold of 17.034 ng/ml (95% CI 12.61–21.46). Piecewise linear regression indicated an optimal threshold of 17 ng/ml (42.4 nmol/liter; P = 0.007; adjusted R2 = 0.016). Before this threshold value, statistically significant decreases in serum osteocalcin were indicated with increases in serum 25OHD; however, this effect plateaued after threshold (C). For uNTx/Cr, nonlinear regression converged on a threshold of 18.0 ng/ml (95% CI 14.347–21.653), with an optimal threshold of 17.5 ng/ml (43.7 nmol/liter; P = 0.0002; adjusted R2 = 0.036). Similarly, a plateau effect was evidenced after the threshold (D).

