Fig. 6.
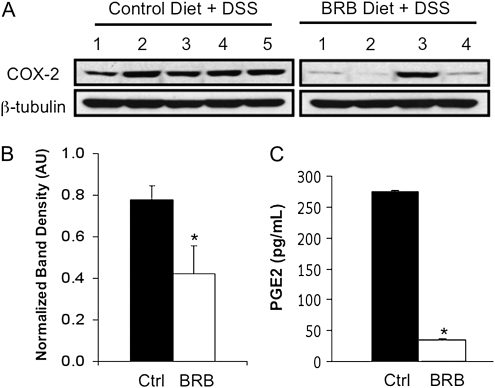
The effects of BRB on DSS-induced changes in COX-2 and PGE2 levels. Mice were administered 3% DSS in the drinking water along with either control or 10% BRB-incorporated powder diet. After 7 days, colons were harvested and protein lysates were prepared for (A) immunoblotting analysis of protein expression. Numbers over lanes represent individual mice within treatment groups and (B) band intensities were quantified as described in Materials and Methods. (C) Plasma was also prepared from mice and PGE2 levels were determined by enzyme-linked immunosorbent assay. Data are means ± standard errors of the mean, n = 5 mice per group. *P < 0.05, comparing control diet group and BRB diet group (unpaired t-test).

