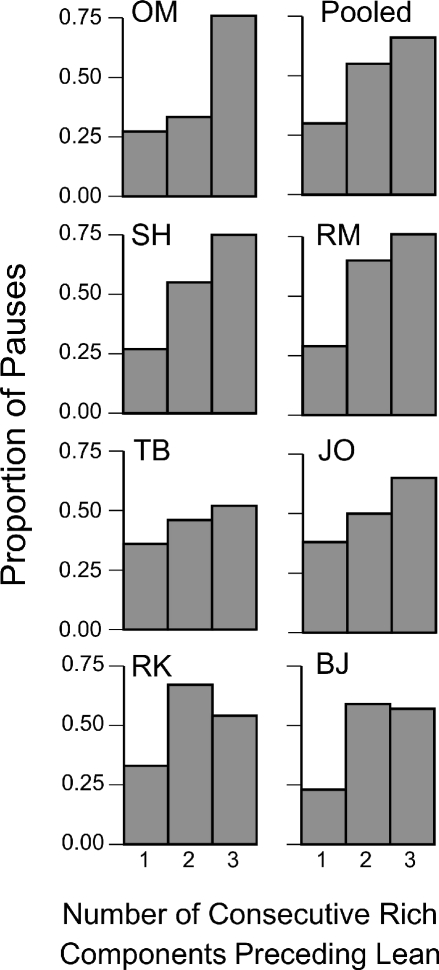
Fig 4.
Proportion of rich-to-lean transitions in Experiment 1 with pauses longer than the overall median pause in all rich-to-lean transitions. The proportion appears as a function of the number of consecutive rich components that preceded the lean component. The Pooled graph combines the results from all 7 participants.

