Figure 3.
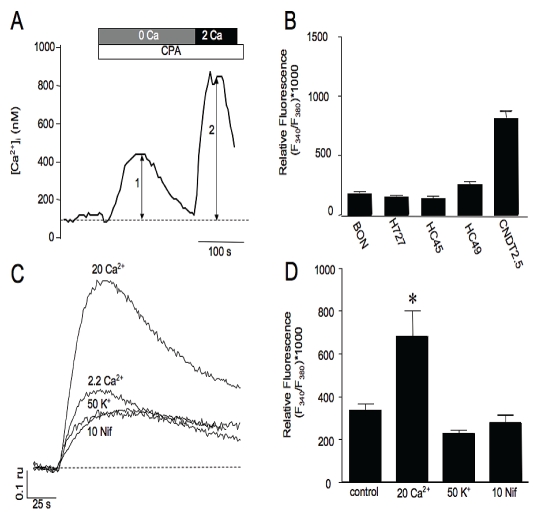
Functional assessment of SOCE in carcinoid cell lines. A. Representative fura-2 trace in a BON cell showing SOCE response (arrow 2) induced by restoration of extracellular Ca2+ to bath solution following store-depletion (arrow 1) with CPA in nominal Ca2+ containing bath solution. B. Averaged peak amplitudes of SOCE responses. C. Induced influx was augmented by increasing [Ca2+]o to 20 mM, reduced by membrane depolarization and was not significantly altered by treatment with 10 μM nifedipine (trace 4) compared to control. D. Averaged amplitudes of SOCE activated following treatments indicated in C.

