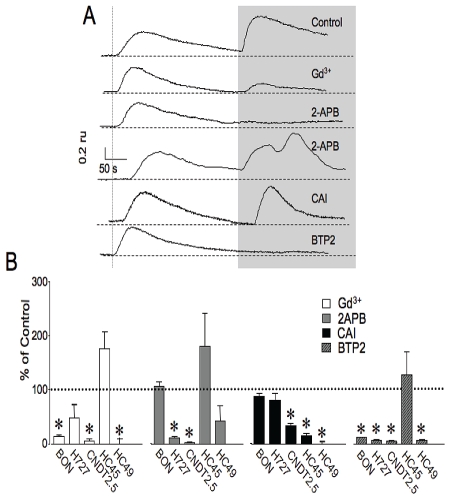
Figure 4.
Representative fura-2 traces in BON cells (A) and average peak amplitudes in cell lines tested (B) showing effects of various channel inhibitors on SOCE following restoration of extracellular Ca2+ (shaded box). For comparison, traces in A were normalized to Ca2+ release peak amplitude. B. Reduction in peak amplitude of SOCE following treatment with inhibitors was compared to control. For BON, H727, CNDT2.5, HC45 AND HC49, the percent reductions in SOCE are listed respectively. Gd2+: 15±3, 49±25, 6±4, 178±32, 0.75±10; 2APB: 107±9.3, 10.4±4, 2.2±6.3, 170±65, 38±30; CAI: 89±6, 81±12, 34±5, 15±5, 0.5±5; BTP2: 12±1.5, 7.4±1.5, 5.5±1, 129±44, 7±3.2; n = 6-104; for significance, p value was < 0.05.

