
Figure 3.
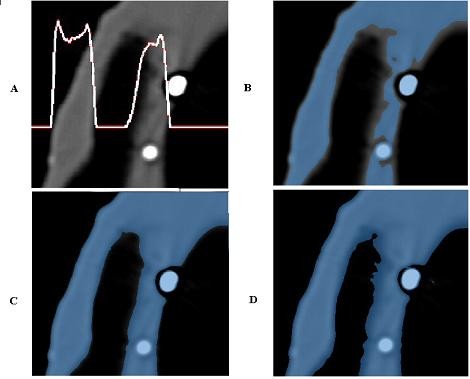
(A-D) CT data segmentation process. (A) DICOM image of the radiographic template with associated a row grey intensity level, (B-D) segmentation with three different threshold values.
Official websites use .gov
A
.gov website belongs to an official
government organization in the United States.
Secure .gov websites use HTTPS
A lock (
) or https:// means you've safely
connected to the .gov website. Share sensitive
information only on official, secure websites.
(A-D) CT data segmentation process. (A) DICOM image of the radiographic template with associated a row grey intensity level, (B-D) segmentation with three different threshold values.