Fig. 3.

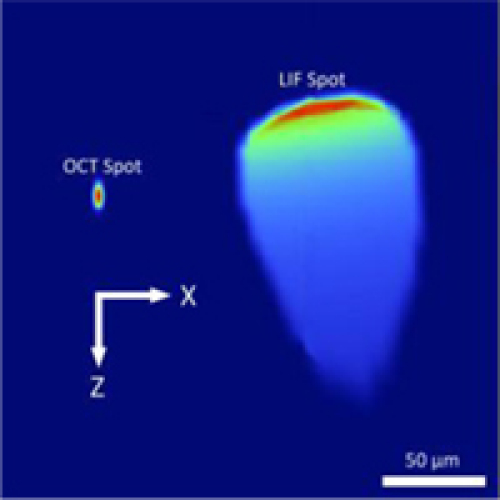
OCT and LIF excitation spots at window. Spots are only separated by 100 μm circumferentially (x-axis) x 50 μm axially (z-axis).

OCT and LIF excitation spots at window. Spots are only separated by 100 μm circumferentially (x-axis) x 50 μm axially (z-axis).