Fig. 5.

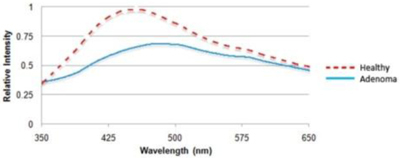
LIF Spectra taken for healthy tissue and adenoma. For adenoma, the emitted fluorescence has a lower intensity and red shifted peak wavelength.

LIF Spectra taken for healthy tissue and adenoma. For adenoma, the emitted fluorescence has a lower intensity and red shifted peak wavelength.