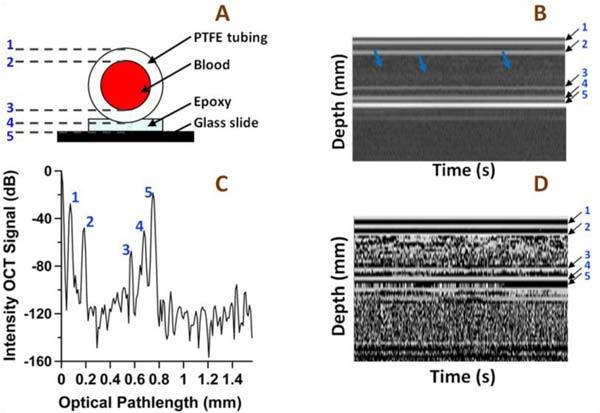
Fig. 2.

A) Blood vessel phantom geometry, B) M-mode intensity map, C) intensity OCT A-scan, and D) M-mode phase map. The lines of constant phase in the M-mode phase map and spikes on the intensity OCT map and A-scan correspond to: 1 – the upper air-vessel interface (optical pathlength, op = 73 µm), 2 – upper vessel-blood interface (op = 187 µm), 3 – lower blood-vessel interface (op = 572 µm), 4 – vessel-epoxy interface (op = 676 µm), 5 - epoxy-glass slide interface (op = 749 µm). The blue arrows in the Intensity map indicate boundary between RBC poor blood plasma and RBC dense layer due to sedimentation.
