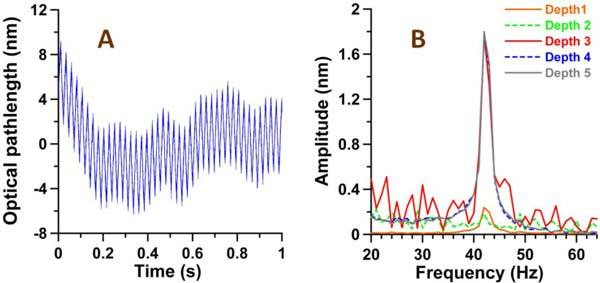
Fig. 3.

A) Optical pathlength (op) variation at depth 5 (linear trend subtracted) in response to laser excitation (blood-gas SaO2 = 18.5%, excitation at 800 nm at 42 Hz). B) Amplitude of op variation at depths 1-5 vs laser excitation modulation frequency (grey trace in Fig. 3B is magnitude of fast Fourier transform of op depicted in A).
