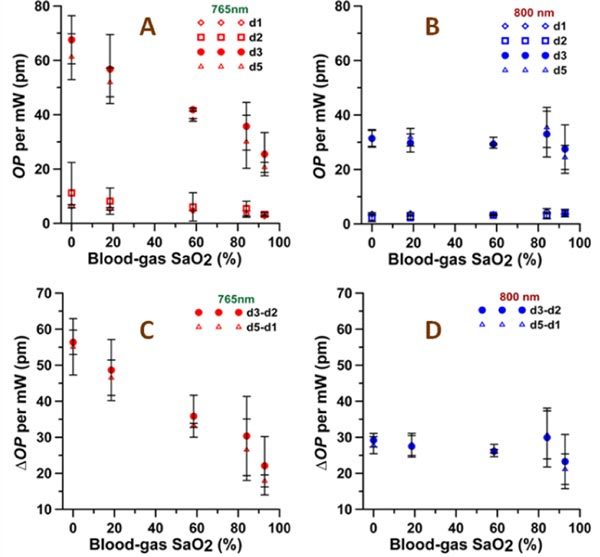
Fig. 4.

Optical path (op) variation amplitude per 1 mW power of excitation light vs. reference avoximeter readings. OP variations are at depths 1, 2, 3, 5 for A) 765 nm and B) 800 nm excitation light. ΔOP variations between depths 3 and 2 (Δop32) and between depths 5 and 1 (Δop51) that was used for calculating of SaO2 levels for C) 765 nm and D) 800 nm excitation light. Error bars are mean ± SD, n = 3-5.
