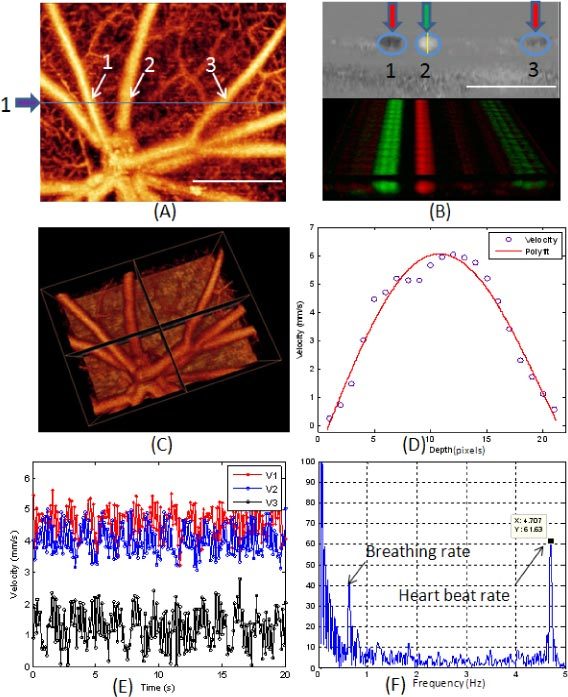
Fig. 4.

Measurement of absolute velocity within retinal blood vessels in the rat. (A) Microvasculature angiogram of a normal rat retina in vivo where the blue line and arrow indicate where the D-OMAG data were captured. (B) D-OMAG phase difference map in one cross section (upper row) and the 3D rendered phase difference extended in 20 seconds at the same cross section. C) 3D vasculature image showing the vessel orientation that was used for calculating the Doppler angle and vessel diameter for the vessels analyzed. (D) The axial velocity profile of vessel 2 along depth direction. (E) The axial velocities in the three vessels over 20 sec periods and (F) the FFT of the values for V2 in (E). White bar = 500 µm.
