
Fig. 5.
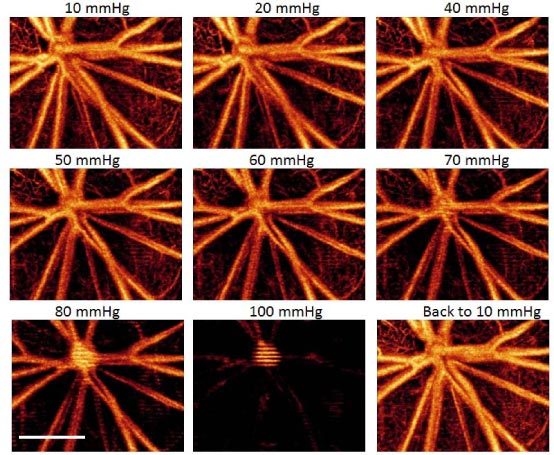
Representative UHS-OMAG micro-angiogram maps of the rat RBF showing the changes of retinal microvascular network around the optic disk due to the increase of IOPs (10 mmHg to 100mmHg), and its reperfusion after the IOP returned back to 10 mmHg. The IOP in mmHg is given in the upper middle of each image, and white bar = 500 µm.