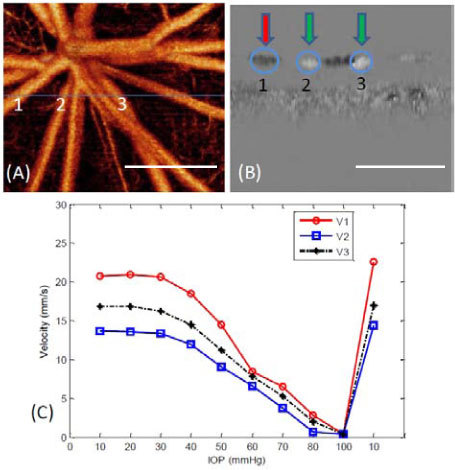
Fig. 6.

(A) shows the microangiogram from Fig. 5 used for locating the vessels for quantitative analysis. The position marked as the blue line indicates the cross-section where the Doppler OMAG data were captured. (B) Cross-sectional Doppler phase image obtained using D-OMAG algorithm. (C) Plot of the absolute blood flow velocity at the center of the three vessels 1, 2 and 3 shown in (A) and (B) labeled as V1, V2, V3 versus different IOPs. Vessel 1 is an artery while vessel 2 and 3 are veins. White bar = 500 µm.
