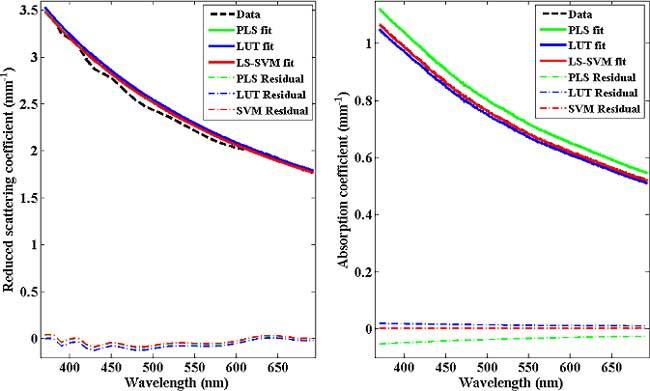
Fig. 1.

Reduced scattering and absorption coefficients as a function of wavelengths. The dashed line indicates the raw data and PLS, LUT and LS-SVM model fits are shown with green, blue and red solid lines, respectively. For this representative phantom, PLS (green) and LS-SVM (red) fits for the reduced scattering coefficient are nearly coincident. Similarly, the raw data (black) and LS-SVM (red) fit coalesce for the absorption coefficient plot.
