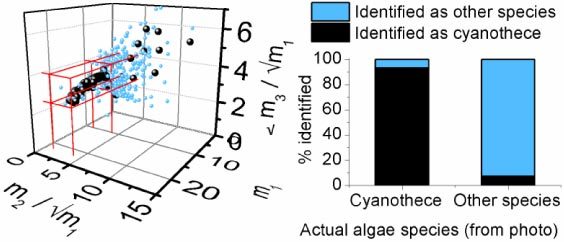
Fig. 5.

(Left) The mi values for each test, representing the maximum value found in the convolution of the test with the sets of test function shapes shown in Fig. 4. The black points are Cyanothece (216 tests), as identified visually from the microscope photos, and the lighter blue points are all other species (403 tests). The volume in m-space chosen as in Eq. (3) to distinguish the Cyanothece is marked in red . (Right) Summary of the results of the automated method for distinguishing Cyanothece from the other algae species.
